
Is a recession coming? Or here?
Nothing is ruled out, even in a strong jobs report

The economy added 223,000 jobs in December, bringing the total growth for the year to 4.5 million. That yearly number isn’t just high, it’s historic. But it doesn’t rule out a recession is coming; it doesn’t even rule out that a recession started last month.
Let’s do some graphletics. I like to build a story of where the data/image comes from by showing you how the raw data is transformed into the final visual.
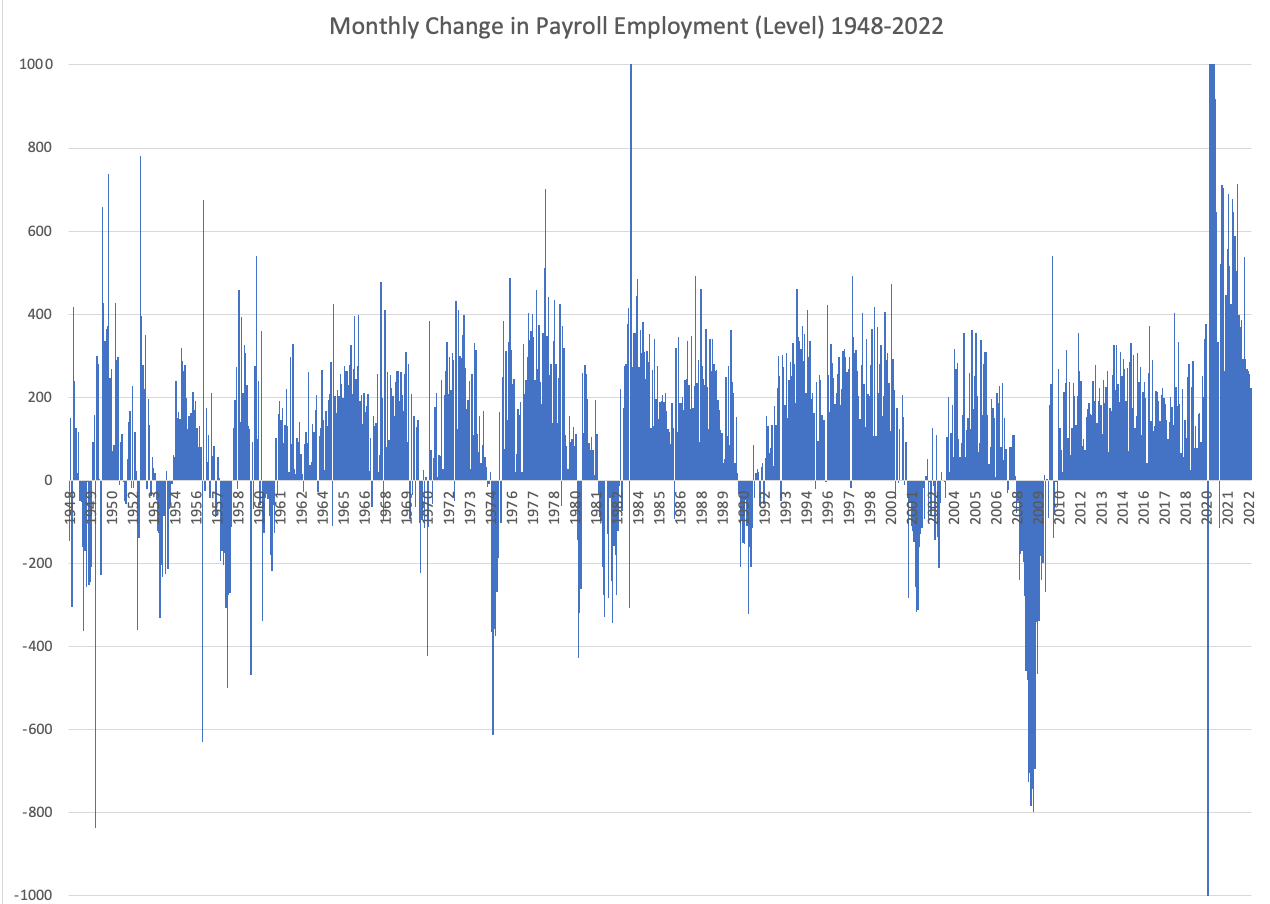
First is the monthly change in the number of jobs, going back to 1948. It’s a nonsense, inscrutable graph because the axes have to account for April of 2020, when the economy shed 20.5 million jobs in a month. But it’s also a good reminder of where we were just a few years ago: freefall.

Here’s the same data, but with the axes clipped so you are zoomed in on most of the monthly changes. What you can see is that adding 223,000 jobs would be a bit above average for the economy. The ten years before the pandemic, 150,000 was typical.
But it’s still a little hard to see through the small spikes, and it doesn’t take into account that the total number of jobs has changed since 1948. The monthly number should be growing with the economy. To show that, I use percentages: the change in the number of jobs from one year prior as a share of total jobs. This year-over-year curve gives a clear picture of job growth and loss. 2020 is still clipped.

And just for brownie points, I’ll put the change in jobs from one year prior as a share of population. These two figures would have no difference if the labor force participation rate was constant, but it’s not. Labor force participation has been declining since 2000. It looks *pretty* close, but it’s different. And the way you can tell is that the peaks of job growth in the last two years are on par with the peaks of the 1970s, instead of below it.

A big misconception people have about recessions is that they align with job losses—the economy lost jobs, therefore the recession has begun. The inverse of that is—the economy is not in recession, because it is still adding jobs. The latter is not true. In 1973, for example, the economy gained jobs for the first 9 months of the recession.
I added the recessions, shaded in grey, to the 12-month change figure.

Zooming in on pre-1980:

And post:

With the exception of 1948 recession (which is missing the pre-recession data because the data only start in 1948), every recession has begun when the 12-month change in jobs is falling. Even 1973! Sometimes recessions start and the economy is still adding jobs, or it has already started shedding them. It depends on the recession. But this trend in growth is consistent, recessions start on the downslope.
Of course, the flip side to this is, not every downslope ushers in a recession. You can see some: two in the 60s, one in the 70s, one in the 80s, one in the 90s. These non-recession slowdowns tend to happen on the heels of a recovery. The economy loses job in a recession, recovers those lost jobs in a recovery, and then the pace slows down.
December’s jobs report could go either way, and that’s the key policy lesson. We aren’t out of the woods, we’re still in a tenuous place.
(Just for the data curious, here’s the monthly percentage change with shaded recessions, so you can see how much the 12-month change smooths it.)

)
Recessions start on the downslope. I will remember that.